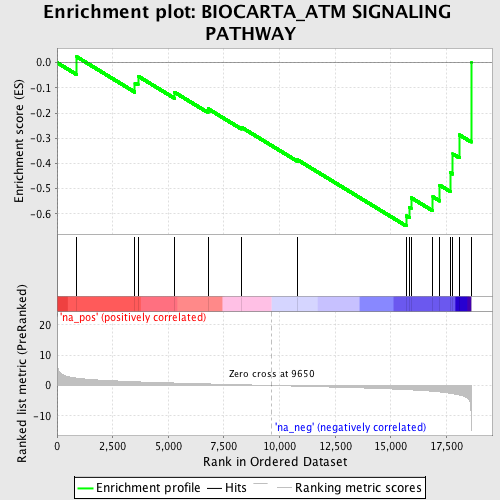
Profile of the Running ES Score & Positions of GeneSet Members on the Rank Ordered List
| Dataset | set04_transDMproB_versus_LMproB |
| Phenotype | NoPhenotypeAvailable |
| Upregulated in class | na_neg |
| GeneSet | BIOCARTA_ATM SIGNALING PATHWAY |
| Enrichment Score (ES) | -0.6483286 |
| Normalized Enrichment Score (NES) | -1.8402162 |
| Nominal p-value | 0.001858736 |
| FDR q-value | 0.056887344 |
| FWER p-Value | 0.6 |
| PROBE | GENE SYMBOL | GENE_TITLE | RANK IN GENE LIST | RANK METRIC SCORE | RUNNING ES | CORE ENRICHMENT | |
|---|---|---|---|---|---|---|---|
| 1 | NFKBIA | 885 | 2.388 | 0.0230 | No | ||
| 2 | MDM2 | 3499 | 1.227 | -0.0811 | No | ||
| 3 | ATM | 3638 | 1.186 | -0.0535 | No | ||
| 4 | GADD45A | 5285 | 0.815 | -0.1179 | No | ||
| 5 | CHEK1 | 6785 | 0.522 | -0.1830 | No | ||
| 6 | RELA | 8283 | 0.243 | -0.2563 | No | ||
| 7 | ATR | 10794 | -0.209 | -0.3851 | No | ||
| 8 | MAPK8 | 15692 | -1.351 | -0.6084 | Yes | ||
| 9 | BRCA1 | 15837 | -1.405 | -0.5746 | Yes | ||
| 10 | CHEK2 | 15913 | -1.436 | -0.5361 | Yes | ||
| 11 | RAD51 | 16891 | -1.889 | -0.5328 | Yes | ||
| 12 | RPA1 | 17200 | -2.124 | -0.4865 | Yes | ||
| 13 | TREX1 | 17668 | -2.565 | -0.4357 | Yes | ||
| 14 | JUN | 17790 | -2.698 | -0.3624 | Yes | ||
| 15 | ABL1 | 18084 | -3.088 | -0.2868 | Yes | ||
| 16 | TP53 | 18610 | -10.661 | 0.0003 | Yes |
